Analytics for B2B become the secret sauce behind many successful sales strategies.
In a complex B2B environment (with longer sales cycles and multiple takeholders), relying on gut feeling is like throwing darts in the dark. Data shines a light.
In fact, research shows that B2B companies that personalize with AI and analytics are 1.7× more likely to grow their market share.
This article explores how B2B leaders can harness analytics to drive sales – and how Shopware, one of the leading e-commerce platforms, supports that journey.
Why data is the real driver behind B2B sales
Data helps you confidently answer on your quarterly sales meeting. What type of questions?
- Which customer segment brought in the most revenue
- Where deals are stalling in the pipeline
- How often your customers come back to buy again
But if you can’t answer these, you’re not alone. And this is where analytics helps. It provides the clarity to answer these questions and make bold, informed decisions. It helps you spot trends and buyer behaviors that would otherwise go unnoticed. Every data point – from website clicks to purchase orders – can be a potential insight.
B2B buyers now expect the same precision and personalization they get in B2C. They will walk away if they don’t get it. That means you need to understand your customers deeply – and data is the key.
And while many platforms promise insights, some actually deliver it. Shopware is one of them. Its analytics features are designed to surface exactly the kind of patterns, behaviors, and sales signals that matter in B2B.
Key metrics every B2B leader should track
If you can’t measure it, you can’t improve it.
A central analytics dashboard (like Shopware’s) can give you that: a quick read on sales, customer behavior, and the signals that actually matter.
Of course, not all numbers are worth chasing. Some numbers look good on paper but don’t lead to action (“vanity metrics”), while others are true performance indicators.
For sure you want to focus on actionable metrics – the kind that inform strategic moves. Here are several key metrics B2B leaders should focus onr:
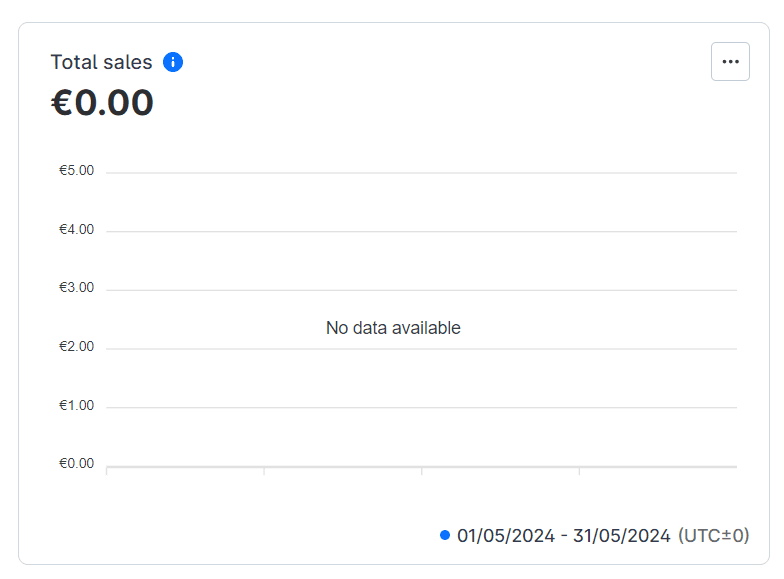
Total sales and revenue growth
This one’s obvious but essential. Track your total sales over time (weekly, monthly, quarterly) to see growth patterns. Are sales rising, flat, or seasonal? This tells you if your overall strategy is working.
Shopware Analytics, for instance, can show gross order value over a given period, helping you assess performance at a glance.
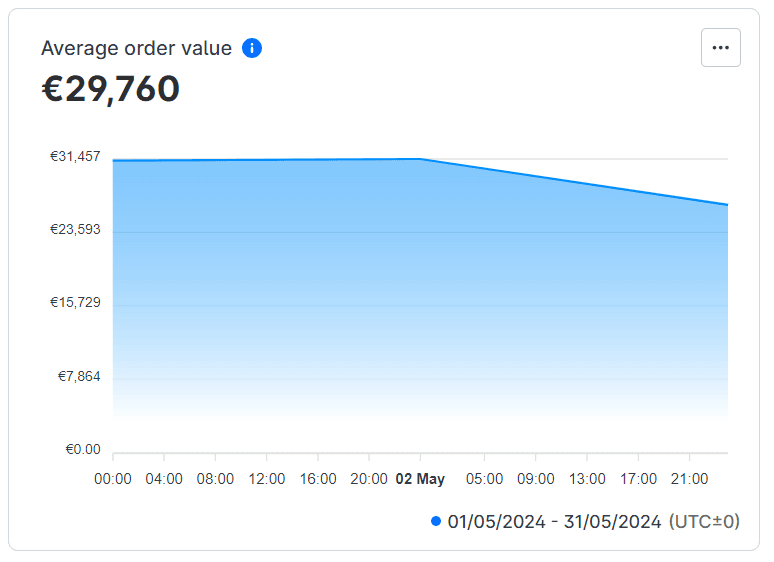
Average Order Value (AOV)
AOV = total sales ÷ number of orders. It shows how much each order is really worth. If you can increase AOV, you boost revenue without acquiring new customers. You might do this by recommending related products or volume discounts. Tracking AOV in Shopware is straightforward – it’s one of the built-in KPIs on the dashboard.
Conversion rate
In B2B e-commerce, conversion rate usually means the percentage of website visitors (or leads) that turn into paying customers. Every online store aims to convert visitors into customers, so this metric is your window into how effective your website and sales funnel are. A low conversion rate signals problems – perhaps a confusing catalog or a tedious checkout – that you need to address.
New vs. returning customers
It’s important to track how many new clients you’re acquiring and how many are coming back for more. Shopware Analytics provides reports on new customer sign-ups in a given period.
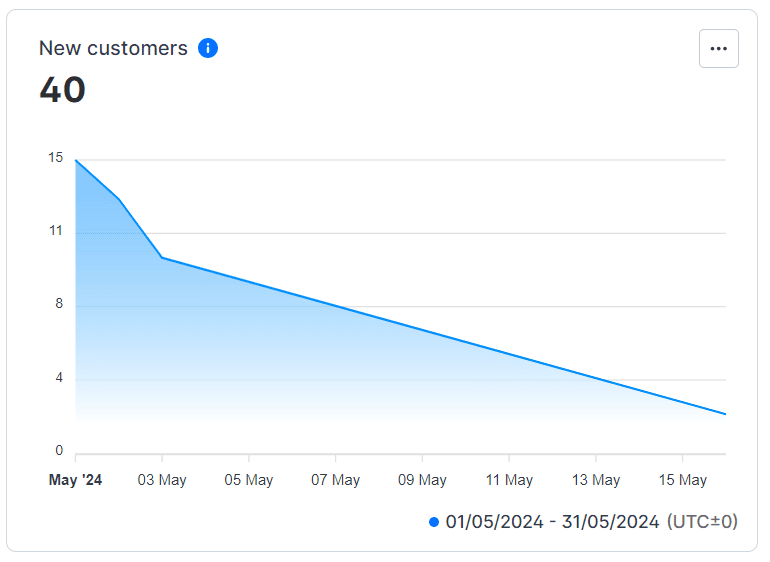
If new customer counts are high but few return, it might mean issues with satisfaction or onboarding. On the other hand, a high rate of returning customers indicates strong loyalty (and likely a healthy customer experience). Both are vital: new customers fuel growth, but returning ones signal stability.
Customer Lifetime Value (CLV)
CLV measures the total revenue a customer is expected to generate over their relationship with your company. In B2B, where accounts can last for years, lifetime value is a strategic metric. A high CLV means each customer is very valuable – possibly justifying higher acquisition costs or more personalized service.
Customer Acquisition Cost (CAC)
Paired with CLV is the cost to acquire a new customer. Though CAC often involves marketing and sales spend data beyond your e-commerce platform, it’s crucial for CEOs to watch. If it costs you $1000 in sales efforts to land a customer who only spends $800 total, that’s a problem.
Aim for CAC < CLV for sustainable growth. (Industry research often finds acquiring a new customer can cost 5× to 7× more than retaining an existing one.
Retention rate and churn
Repeat orders? That’s retention. No reorders? That’s churn. For B2B, churn can mean a client didn’t reorder this quarter or chose a competitor for their next purchase.
Sales cycle length
How long does it take for a B2B lead to go from first inquiry to closed deal (or first order)? The longer the cycle, the more room for delays and drop-offs. Shopware helps you track time-to-purchase using account registration and order dates (or quote-to-order time if you’re using its B2B Suite). You’ll spot bottlenecks and find ways to shorten the journey.
Quote win rate
If you’re using quotes or custom pricing, you need to track how often those turn into actual sales. A low win rate? It might mean pricing’s off, leads are cold, or the quoting process is too slow. To show “win rate,” integrate your Shopware store with CRM data (or use Shopware’s Sales Agent) that centralize this info. The goal is to marry your e-commerce analytics with sales pipeline data for a full picture of performance.
Segment-specific metrics
Finally, don’t just look at these metrics in aggregate. Segment them. B2B businesses often have distinct customer groups – by industry, size, region, etc. For example, what’s your average order value by industry segment? Which region has the highest conversion rate? Shopware Analytics allows filtering data by sales channel, country, or customer group, making it easier to get these insights.
You might find that midsize clients in Europe have double the lifetime value of enterprise clients in another region, leading you to adjust your focus. Actionable metrics become even more powerful when sliced into meaningful segments.
These metrics are the scoreboard for your sales strategy. They tell you what’s working, what needs fixing, and where the next opportunity is hiding. The next step? Making sure your tools are set up to capture these numbers clearly. And we will show how it works in Shopware.
How Shopware supports data-driven sales
Having the right metrics is one thing; getting them easily is another. Shopware 6, known for its flexibility and B2B-friendly features, now offers built-in analytics capabilities that put your vital stats front and center. Here’s how Shopware helps you collect, view, and act on your data:
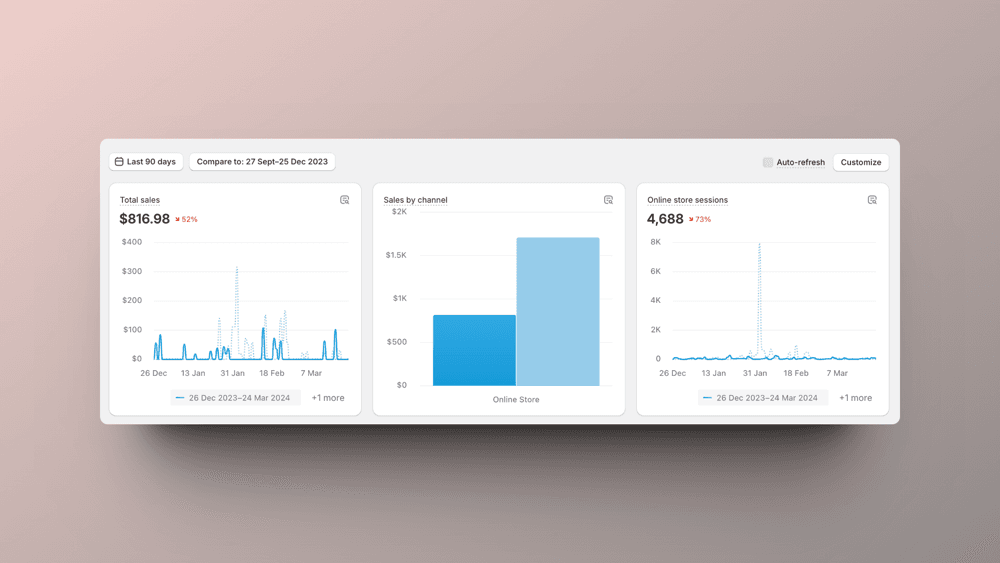
A dashboard built for decision-making
Shopware Analytics (an extension for Shopware 6) plugs directly into your admin panel, creating a new “Analytics” section. Once installed (it’s free on the Shopware Store and works on all editions), you instantly get a suite of dashboards and reports without needing a separate BI tool. These dashboards cover everything from sales and orders to customer trends.
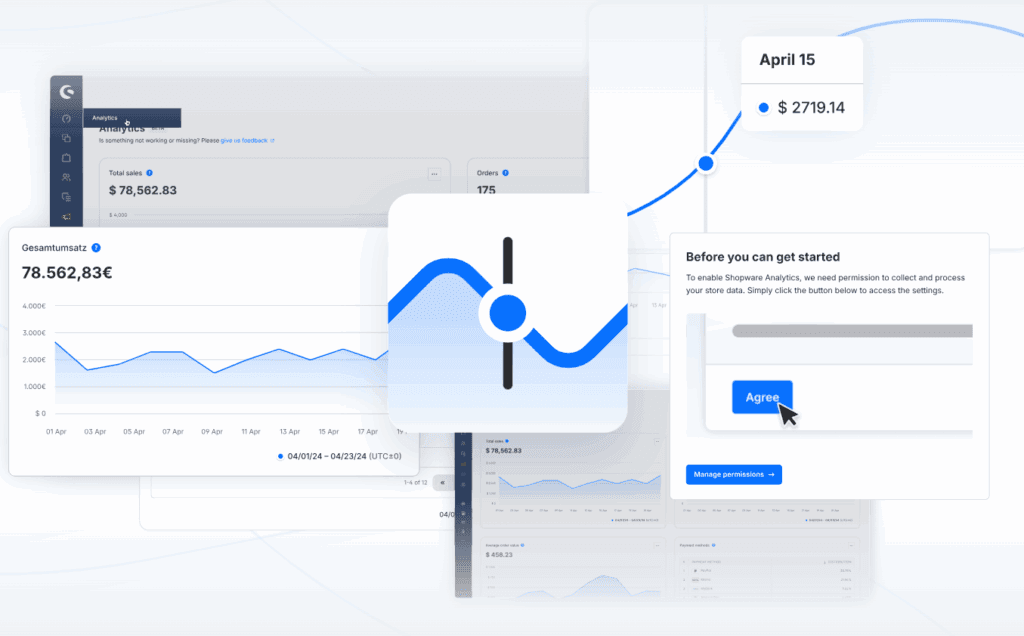
The beauty is the integration – you don’t have to export data to Excel or rely solely on Google Analytics for e-commerce basics. It’s all in one place, updated in real time.
Key Performance Indicators
The Shopware Analytics was built to surface the metrics we discussed earlier. You’ll see charts for Total Sales, Number of Orders, Average Order Value, New Customers, etc., plotted over your selected time period.
For example, you can visualize your revenue over the last quarter, or see daily order counts to identify peaks and valleys. Each metric comes with a little info tooltip explaining what it means, and you can even export any report as CSV for further analysis in spreadsheets.
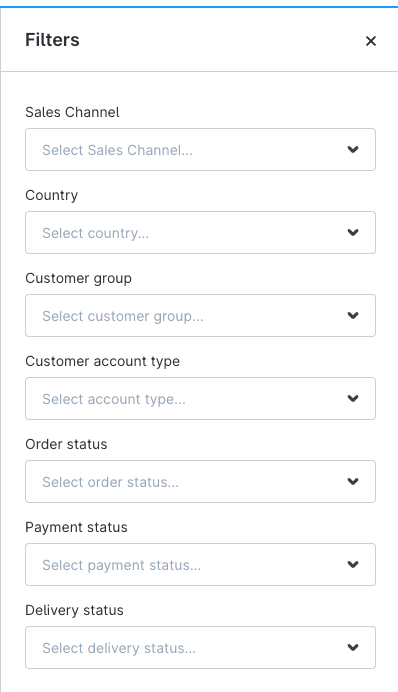
Granular filtering, B2B-style
Shopware knows that one-size-fits-all metrics aren’t enough in B2B. So every dashboard comes with advanced filters. You can break down data by:
- Sales channel (e.g. your online portal vs. another channel)
- Country or region
- Customer group (e.g. wholesale vs. retail)
- Customer type (guest vs. registered)
You can compare segments, spot patterns, and make targeted decisions.
Let’s say you operate in multiple countries – you can filter the sales report to see just the EU or US, and even break down sales by country in a dedicated report. Or, if you have separate customer groups (e.g. “Wholesale Buyers” vs “Retail Buyers”), you can compare their average order values by filtering accordingly.
Website behavior insights (without leaving Shopware)
Beyond the purchase data, Shopware can also track on-site customer behavior, which is critical for conversion insights. With the latest versions, Shopware introduced event tracking for standard storefronts. This means you can get metrics like Page Views and Unique Visitors right in Shopware.
You can observe traffic trends and even see if certain customer groups browse more pages than others. While dedicated web analytics tools might offer deeper dive, Shopware’s built-in tracking gives a quick health check of your site’s engagement. And those data feed into calculating things like conversion rate when combined with order stats.
Continuously improving analytics
One thing worth noting: Shopware is actively evolving its analytics feature set. New dashboards, filters, and use-case-specific reports are added based on user feedback. The product team actively gathers feedback and rolls out new dashboards. So, you might wake up one day and find a new report available because Shopware decided to add, say, a customer cohort analysis or a product performance dashboard based on popular demand. This agile improvement cycle means your analytics capabilities expand over time.
Flexible exports and integrations
With B2B data, you might also want to feed it into your company’s broader BI systems or just keep backups. Shopware makes it easy to export data (as mentioned, any chart’s data can be downloaded in CSV). So if your analysts want to mash up e-commerce data with CRM or ERP data, they can. Also, because Shopware is an open platform with an API-first approach, you can integrate external analytics or reporting tools if needed. But many mid-size B2B firms find that Shopware’s own analytics cover their needs for day-to-day decision-making.
Designed with B2B in mind
Shopware is aware that B2B commerce has unique analytics needs. For example, you might have sales rep performance to consider, or quote conversion rates, etc. Some of these go beyond the standard e-commerce metrics.
They’ve introduced a Sales Agent module to unify sales activities, and they plan to layer in B2B-specific analytics on top of that. What’s more, through features like the B2B Suite or third-party plugins, you can collect data on things like corporate account usage, quote requests, etc., which can be reported on.
In short, Shopware serves as your single source of truth for e-commerce data. It not only collects the data but presents it in a digestible way for leadership. Instead of patching together reports from separate systems, you log into Shopware and get a pulse of your business in seconds.
Use case: Improving the B2B sales cycle
B2B sales often involve a journey rather than a one-click purchase. There may be research phases, multiple decision-makers, negotiations, and more. This complexity means there are more points where a deal can stall. Analytics can help you pinpoint those choke points and fix them, effectively streamlining your sales cycle so you close deals faster and more reliably.
Start by mapping the funnel
Let’s start with the basics: your sales funnel.
For a B2B e-commerce setup, it might look something like this:
Visitor ➝ Registered account ➝ Adds to cart or requests quote ➝ Places first order ➝ Reorders
With tracking in place, you can measure conversion rates at each step — and spot where leads are falling off.
Example: out of 1,000 visitors, 100 register. Of those, 50 take the next step. And 30 go on to purchase. A 3% visitor-to-order rate.
But the real insight comes from analyzing drop-offs. What happened to the other 70 account holders who didn’t convert?
Funnel analysis shows where deals stuck
If users register but don’t act, maybe your product info or pricing isn’t clear. If they add to cart but don’t order, maybe the checkout’s too complex. Or they’re waiting for internal approvals and didn’t see how to request a formal quote.
Each stage’s conversion rate gives you a clue. Shopware’s analytics coupled with its event tracking can show, for instance, how many product detail page views turn into actual cart additions (with some custom setup).
Break down the sales cycle length
Let’s say your average sales cycle is 30 days. With analytics, you might discover:
- 5 days from site visit to registration
- 10 days to build a cart or request a quote
- 15 days to finalize the order
Knowing this, a you can implement features to accelerate each stage (perhaps introduce a guided shopping feature or a chatbot for quicker answers early on, and an automated quote generation tool to shorten the negotiation phase).
New tools that actually shorten the cycle
Shopware’s Digital Sales Room lets buyers and sales reps collaborate in one place. It eliminates the back-and-forth email chain, making deals faster to close.
The Sales Agent and B2B Suite features also help. Reps can create quotes and orders directly in the system – and you get full visibility into the timeline from quote creation to conversion.
What about abandoned carts and quotes?
Another scenario: cart abandonment. In B2C e-commerce, cart abandonment is a well-known issue; in B2B, the “cart” might be a quote request or an order list that is saved but not submitted. Analytics can reveal the rate of abandonment.
If you see a high abandonment, it’s a sign to take action. Maybe the shipping costs are scaring them off at the last step (so you consider more transparent shipping quotes earlier in the process), or maybe they’re getting cold feet on a large order (so your sales team might proactively reach out when they see a big pending cart).
Shopware allows you to see incomplete orders or use plugins to track abandoned carts. Combining that with analytics (e.g., noticing at what stage people give up) guides you where to intervene.
Sometimes something as simple as adding a prompt like “Need a formal quote or have questions? Click here and we’ll help!” at the cart stage can rescue a sale – and you’d know to do that because your data flagged an issue.
Win rate matters too
If only 30% of quotes become orders, that’s worth digging into. Maybe it’s product-specific. Or maybe it varies by sales region or rep.
With Shopware data plus CRM insights, you can spot those patterns. A low win rate might mean your pricing needs review – or your team needs more support to close.
Without data, you’re relying on gut feel. With analytics, you know exactly how long deals take, where they slow down, and what helps move them forward.
Conclusion
B2B sales will always be complex. But with the right analytics setup – and the right platform behind it – that complexity becomes manageable. Even predictable. You see the levers that drive growth, and you start pulling the right ones.
So if you’re ready to stop guessing, and start leading with clarity – Shopware is built to help you do just that.
GET IN TOUCH
Need help implementing Shopware or making your analytics actionable?
Let’s build it together.